Sales Analysis Dashboard (Excel)
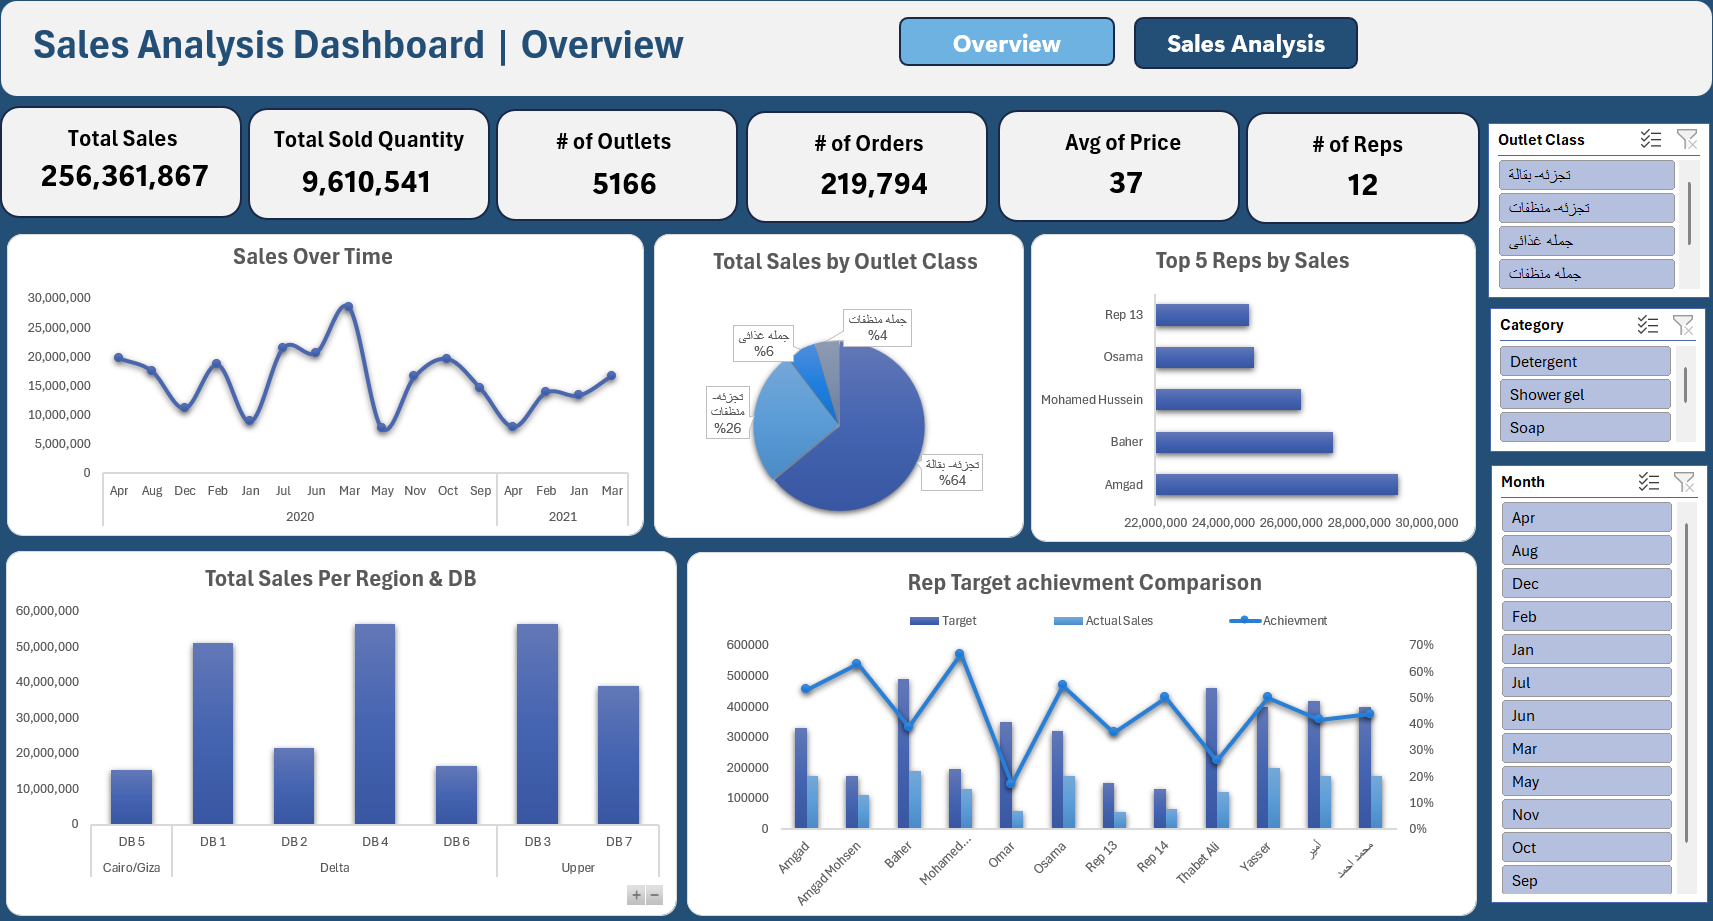
An interactive sales dashboard built entirely in Excel to turn over 256M in revenue transactions into clear, actionable insight — surfacing sales trends, top products, and high-performing outlets for the business.
The Problem & Key Questions
Sales teams often collect massive amounts of data but struggle to turn it into meaningful decisions. This dashboard was built to answer:
- What is the total sales revenue and sold quantity?
- Which outlets and product categories drive the most revenue?
- Which months record the highest sales quantities?
- Who are the top-performing employees?
- What are the top-selling products by both revenue and quantity?
The Dashboard
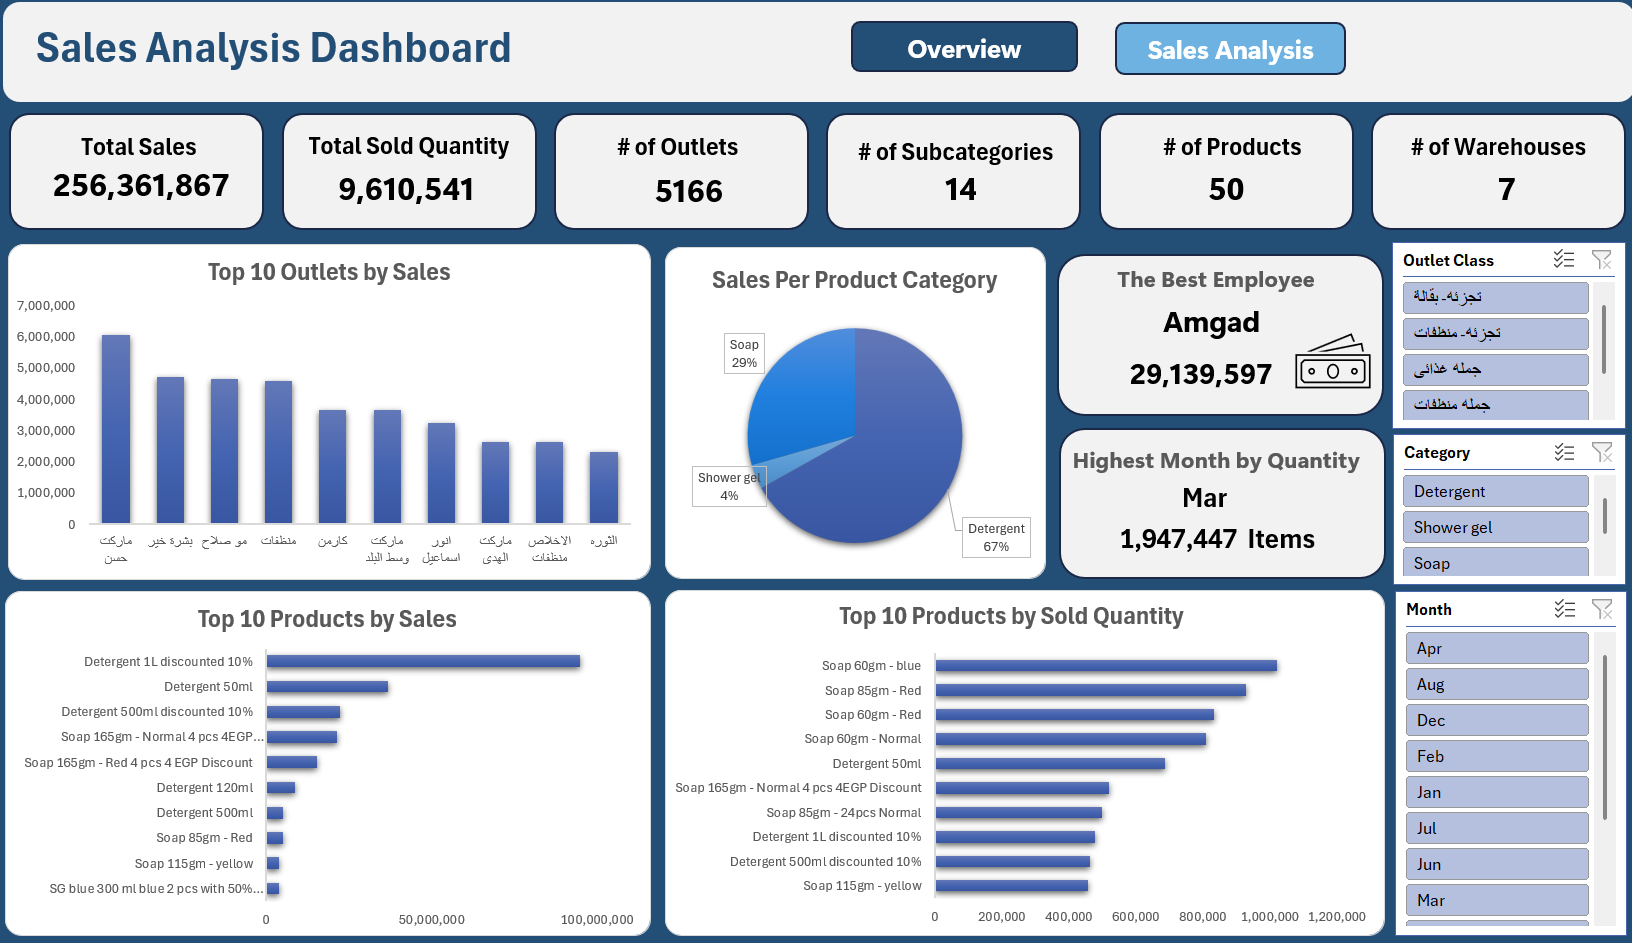
- KPI overview: total sales, sold quantity, and counts of outlets, products, warehouses, and subcategories.
- Top 10 outlets & products: ranks the highest revenue-generating outlets and products, by value and volume.
- Sales per category: a category breakdown across Detergent, Soap, and Shower Gel.
- Best employee & peak month: highlights the top-performing rep and the highest-quantity month.
Slicers for Outlet Class, Product Category, and Month let users switch instantly between a revenue view and a quantity view.
How I Built It
Excel handled the full pipeline — cleaning the raw transactions, building pivot tables, and designing the interactive dashboard visuals.
Key Insights
- Peak sales month: March 2020 recorded the highest quantity sold, at 1.9M items.
- Channel distribution: Wholesale Retail outlets drive 64% of sales.
- Category performance: Detergents dominate, contributing 67% of total revenue.
- Top outlets: outlets like "ماركت حسن" stand out as top revenue drivers.
- Employee recognition: Amgad is the top-performing rep, with over 29M in sales.
Recommendations
Inventory optimization
Increase detergent stock ahead of March to avoid stockouts during peak demand.
Channel focus
Invest more resources into wholesale retail, since it drives the majority of sales, to boost efficiency in the most profitable channel.
Product diversification
Promote Shower Gel to balance the category mix and reduce dependency on detergents.
Employee incentives
Recognize and reward top performers like Amgad to motivate the wider sales team.