Medical Sales Performance Dashboard
A clear, easy-to-use Power BI dashboard built for a medical company to track sales, measure sales-rep performance against targets, and surface the insights that help the business grow. This was my first end-to-end data project, from cleaning the raw data to shipping the final interactive report.
The Problem
The management team needed a better way to see sales performance than complex spreadsheets. They wanted one simple dashboard that could answer key questions quickly:
- Are we hitting our sales targets for the year?
- Who are our best sales reps, and who needs a little more support?
- Which products and customer groups are generating the most revenue?
- Are there important sales patterns over time we should know about?
The Dashboard
The final report has three focused, easy-to-navigate pages:
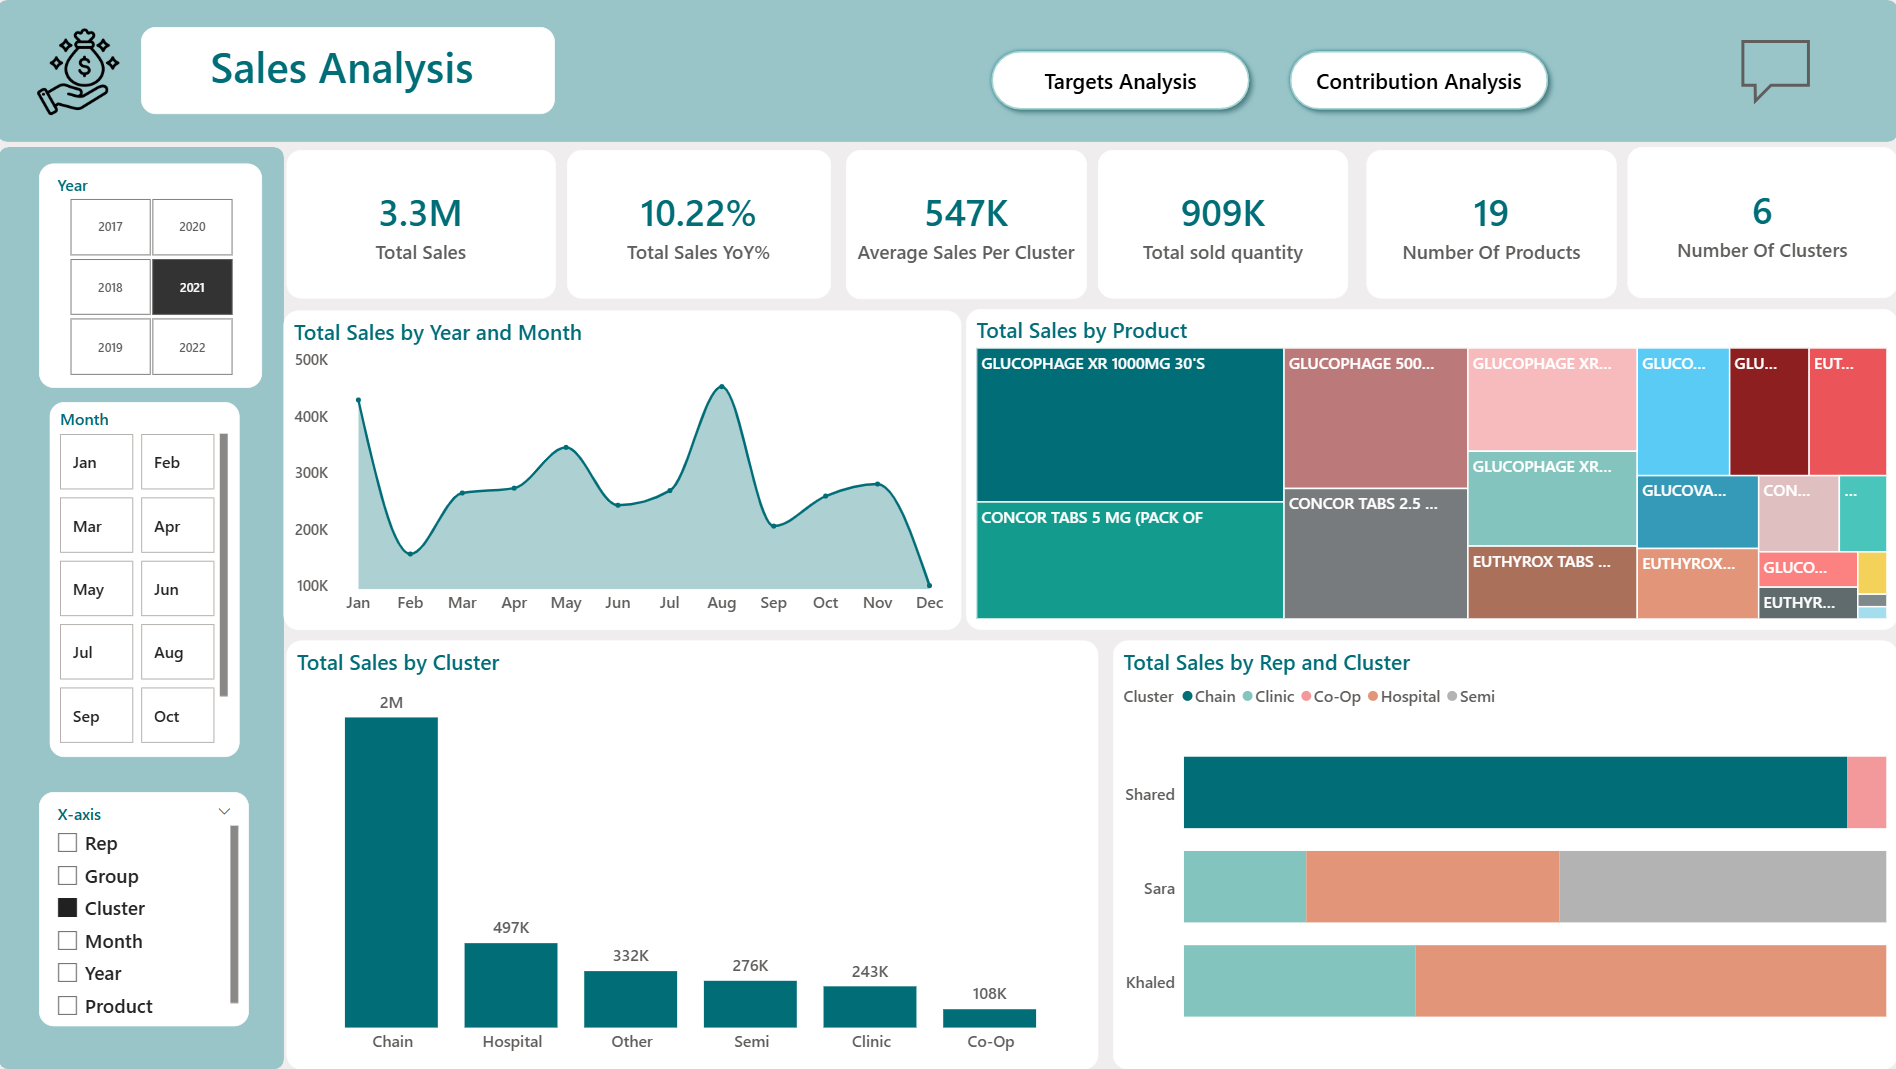
- Sales Analysis: a quick look at Total Sales, growth, and performance by month, product, and customer group.
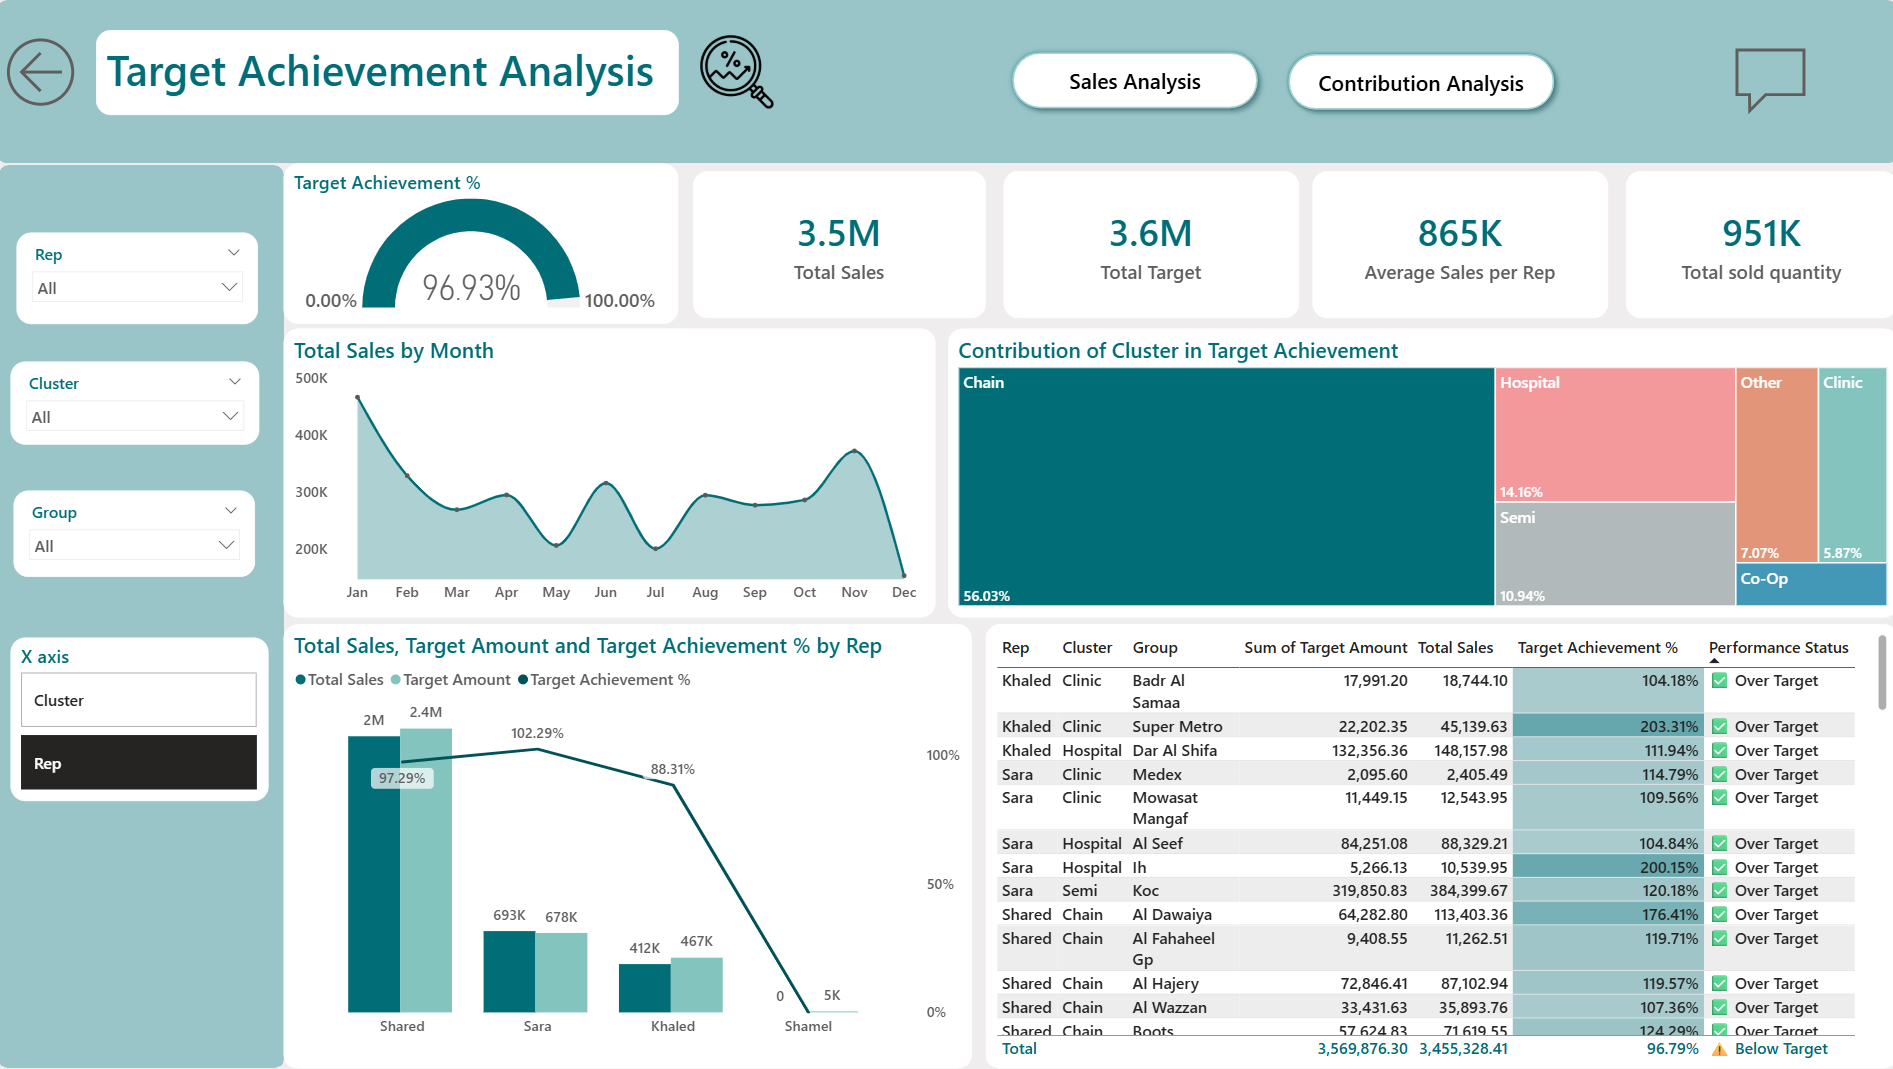
- Target Analysis: compares actual sales to targets for every sales rep.
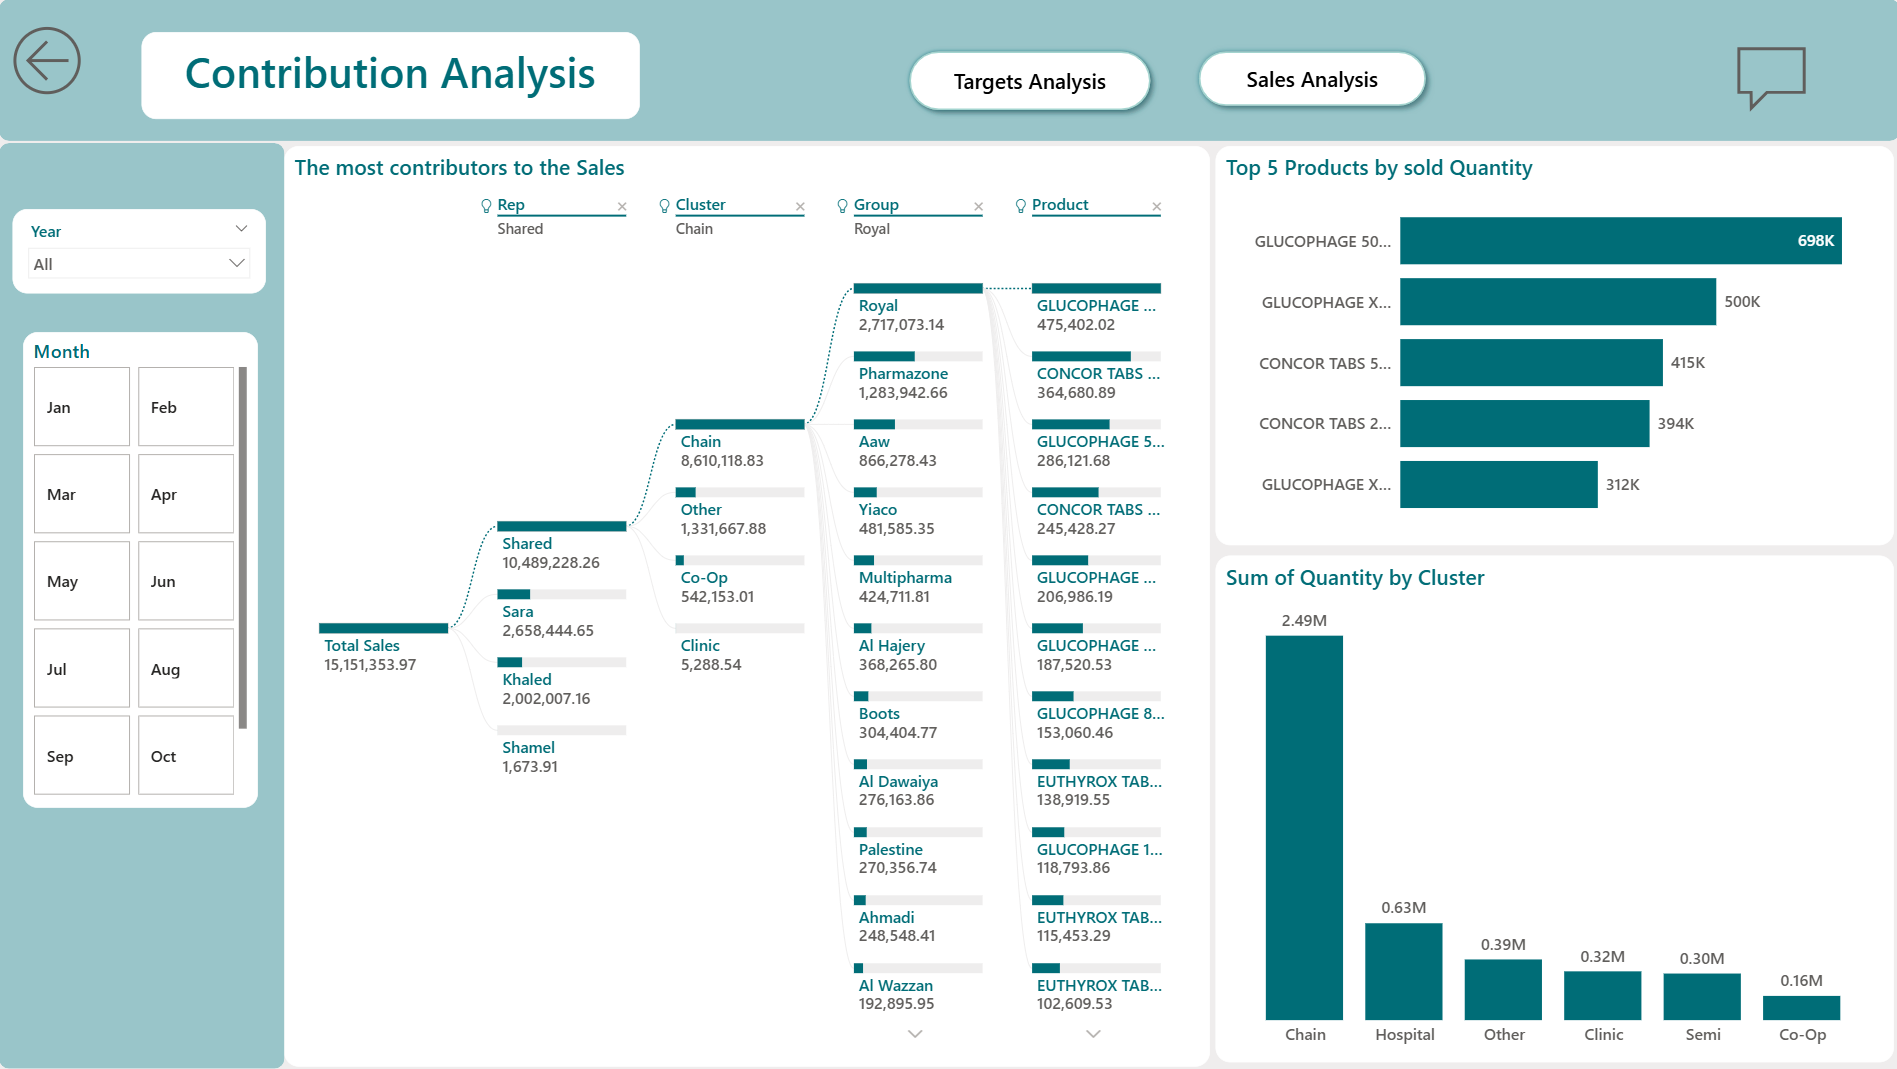
- Contribution Analysis: uses a Decomposition Tree to dig into the details behind the numbers.
Cross-filtering on click, filters for Year / Month / Rep, and hover tooltips make it fast to explore and easy to trust.
How I Built It
The data model connects two main tables — sales and targets — using a Galaxy Schema, which was the best way to keep the comparisons between actuals and targets accurate.
Key Insights
- Almost there: the team hit 96.9% of its yearly target, leaving a small 3.1% gap to close.
- A star performer: Sara was the only rep to beat her target, reaching 102.3%.
- The main money-maker: the "Chain" customer group brings in most of the sales.
- The hit product: GLUCOPHAGE is the best-seller by far — a strength, but also a concentration risk.
- Room to improve: the gap between Sara and the rest of the team shows a clear coaching opportunity.
Recommendations
Learn from the best
Have Sara lead a session sharing her winning sales tips so the rest of the team can adopt what works.
Don't put all eggs in one basket
Launch a small campaign to grow sales in other customer groups, like Clinic and Semi, to reduce dependency on Chain.
Sell more, sell smarter
Bundle GLUCOPHAGE with other products to lift cross-sell revenue and reduce reliance on a single hit product.
Help everyone succeed
Use the dashboard in one-on-one meetings with reps to identify problem areas and build a support plan together.