Adventure Works | Internet Sales Analysis
A comprehensive analysis of internet sales for the global manufacturing company Adventure Works, covering two years of performance. The business request was a dynamic Power BI dashboard to track actual sales against monthly budgets — a tool the management team could explore on their own to find trends and make informed decisions.
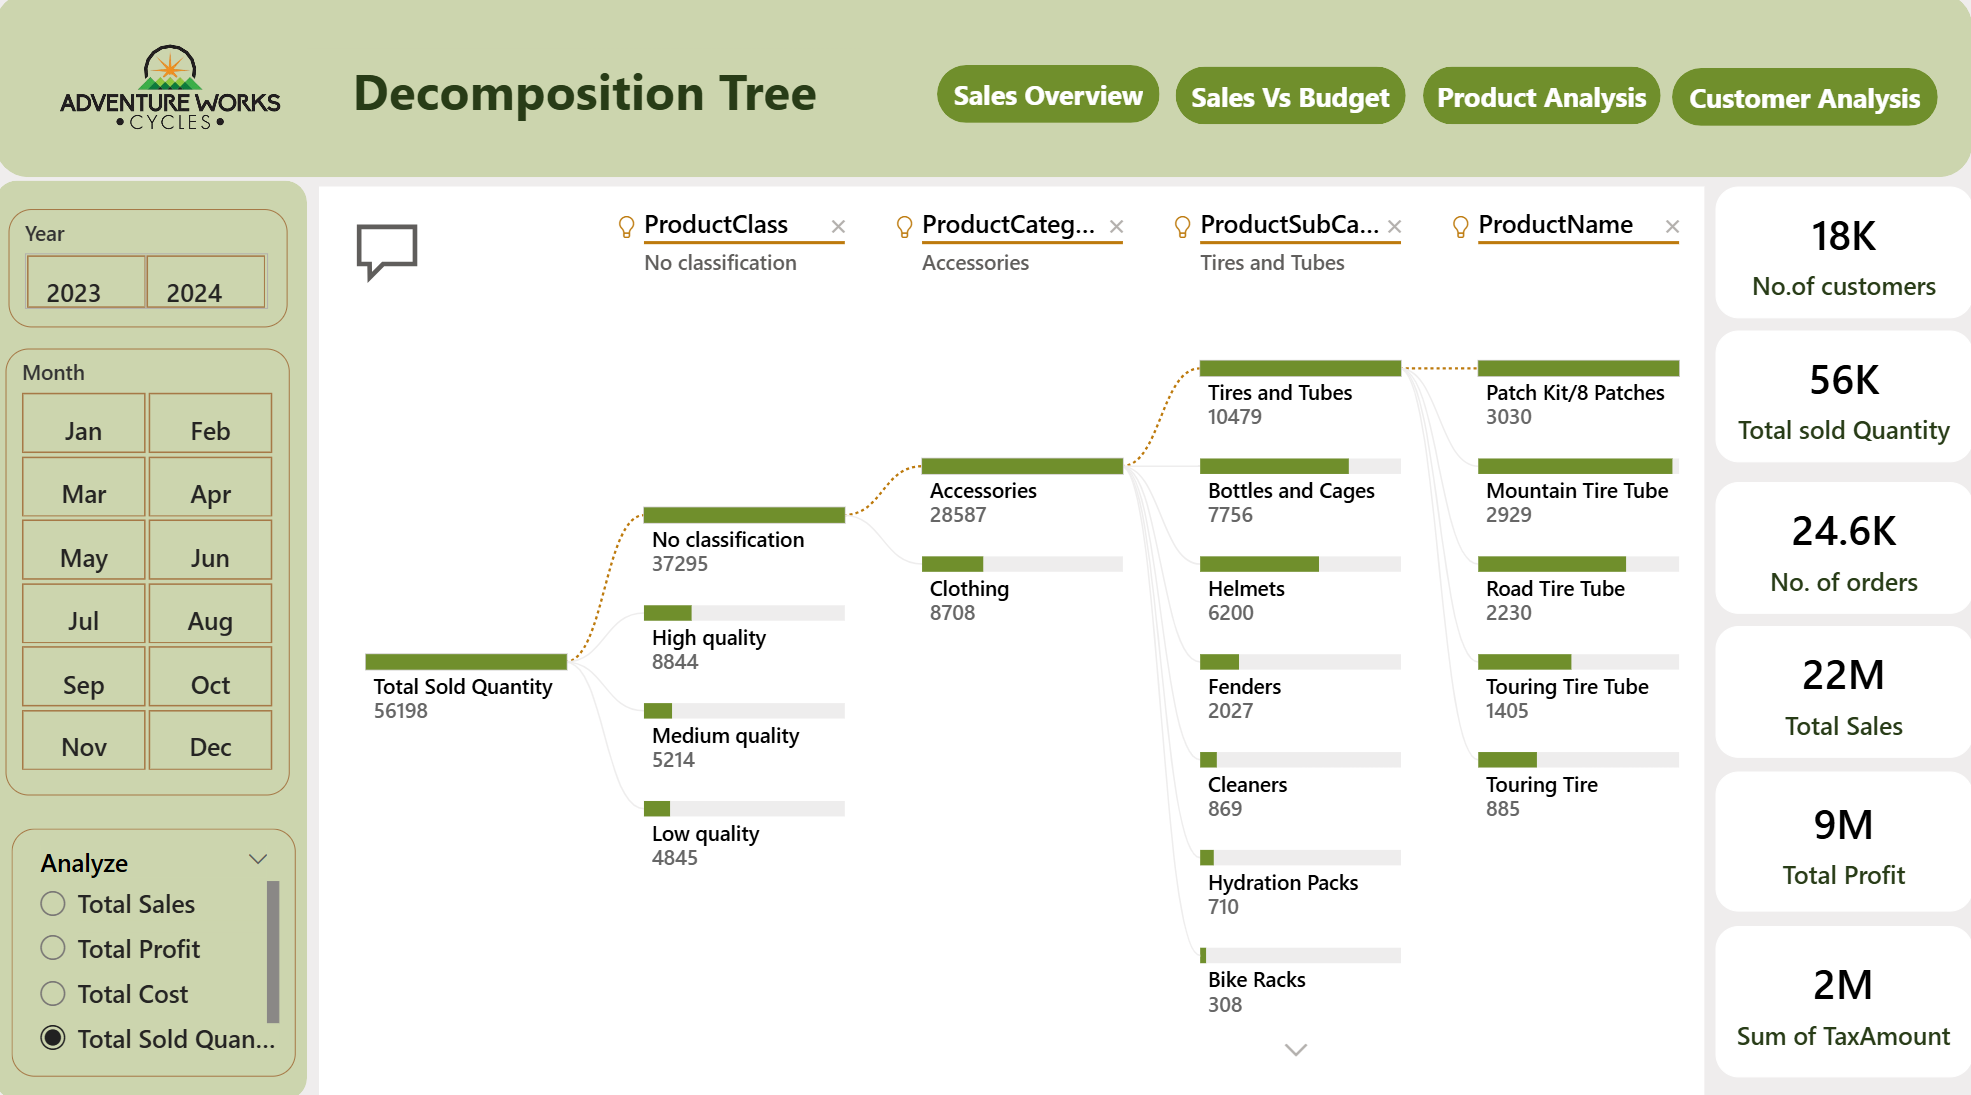
Key Business Questions
- Overall performance: total sales revenue, profit, and growth rate over the last two years.
- Budget vs. actuals: how actual sales performed against the monthly budget, and which months were over or under target.
- Product performance: which categories, subcategories, and products are the top performers.
- Customer & market analysis: the most valuable customers and highest-revenue regions.
- Sales drivers: the primary reasons customers choose to buy.
Data Sources & Methodology
Historical sales data was extracted with SQL queries, then modeled in Power BI using a Star Schema to build clean relationships between facts (sales) and dimensions (products, customers, dates). Custom DAX measures calculate KPIs like Total Sales, Profit Margin, Growth Rate, and Budget Variance across a multi-page interactive dashboard.
Key Findings
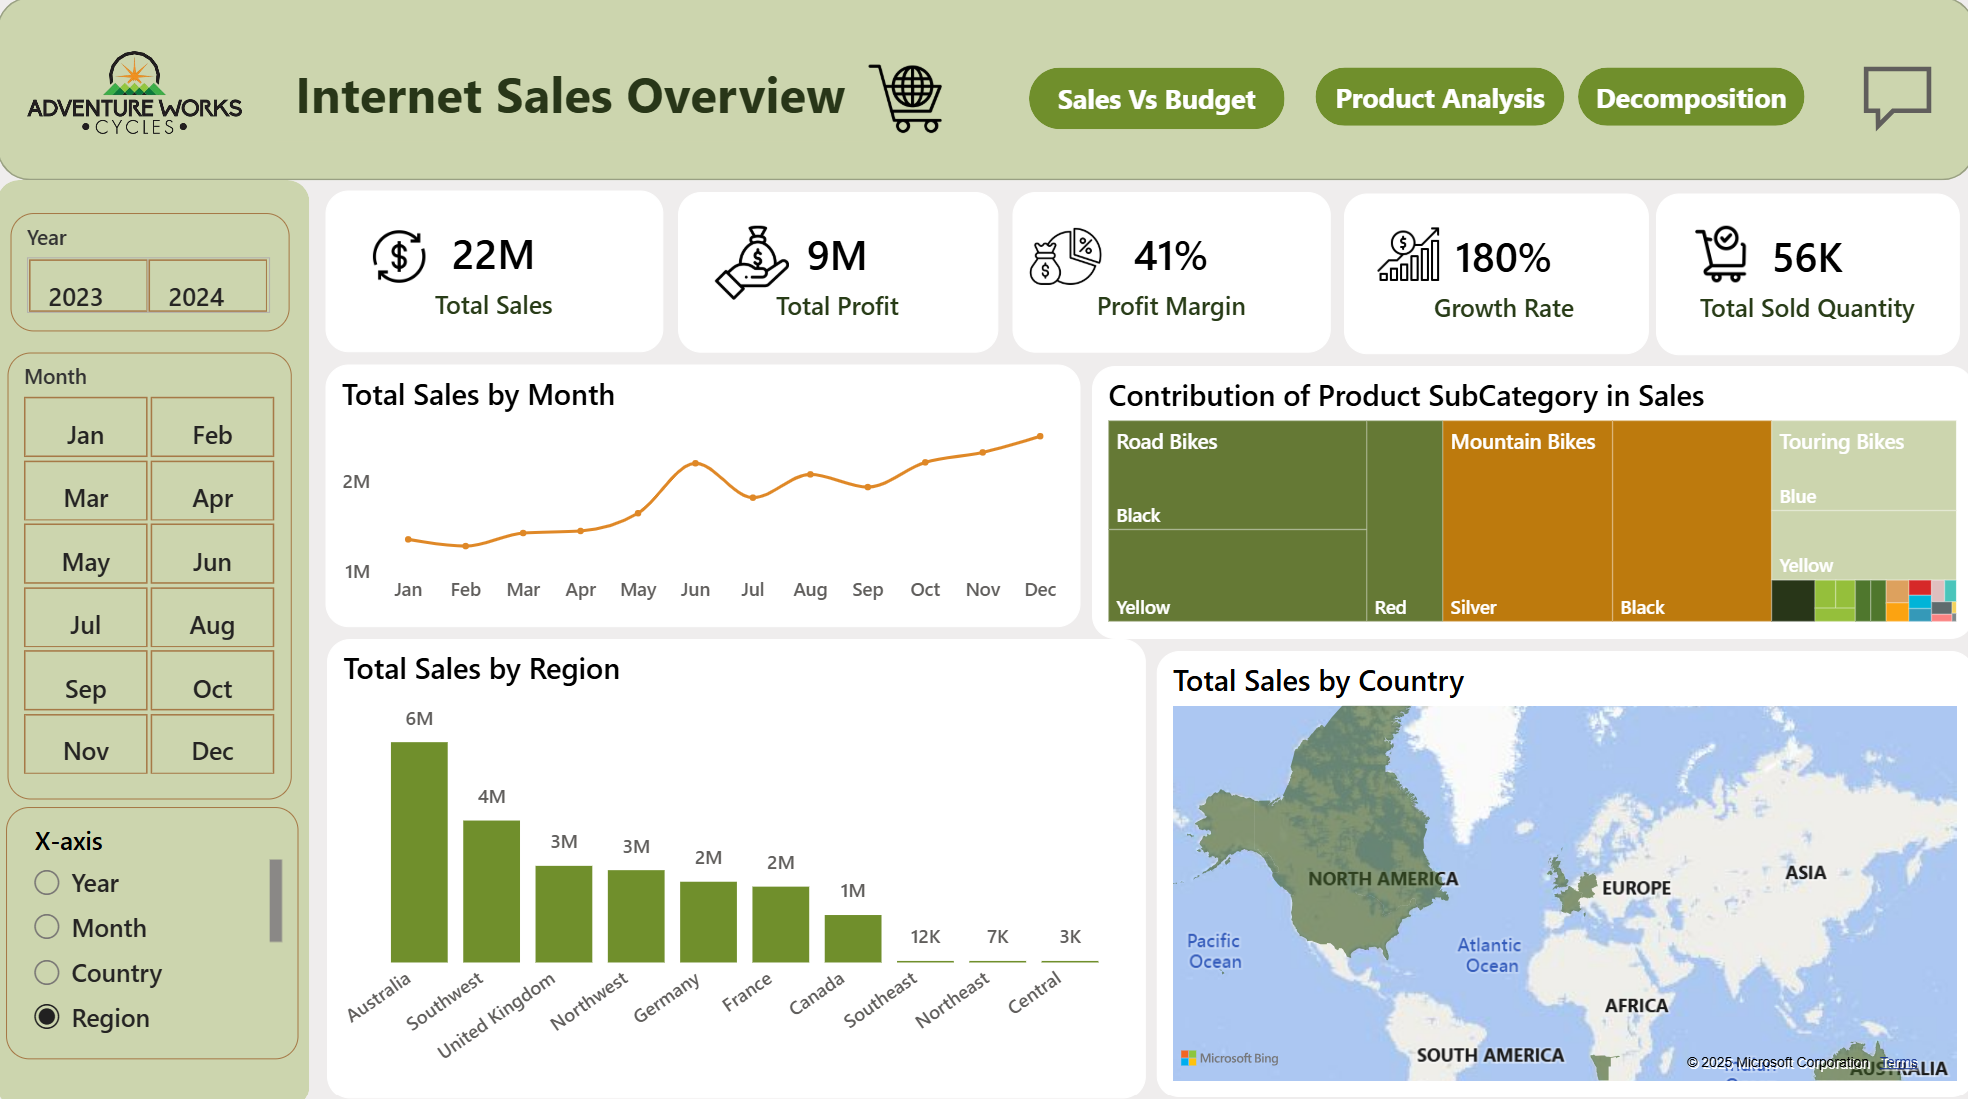
- Strong growth: $22M in sales and $9M in profit over two years, with a 180% year-over-year growth rate and a 41% profit margin.
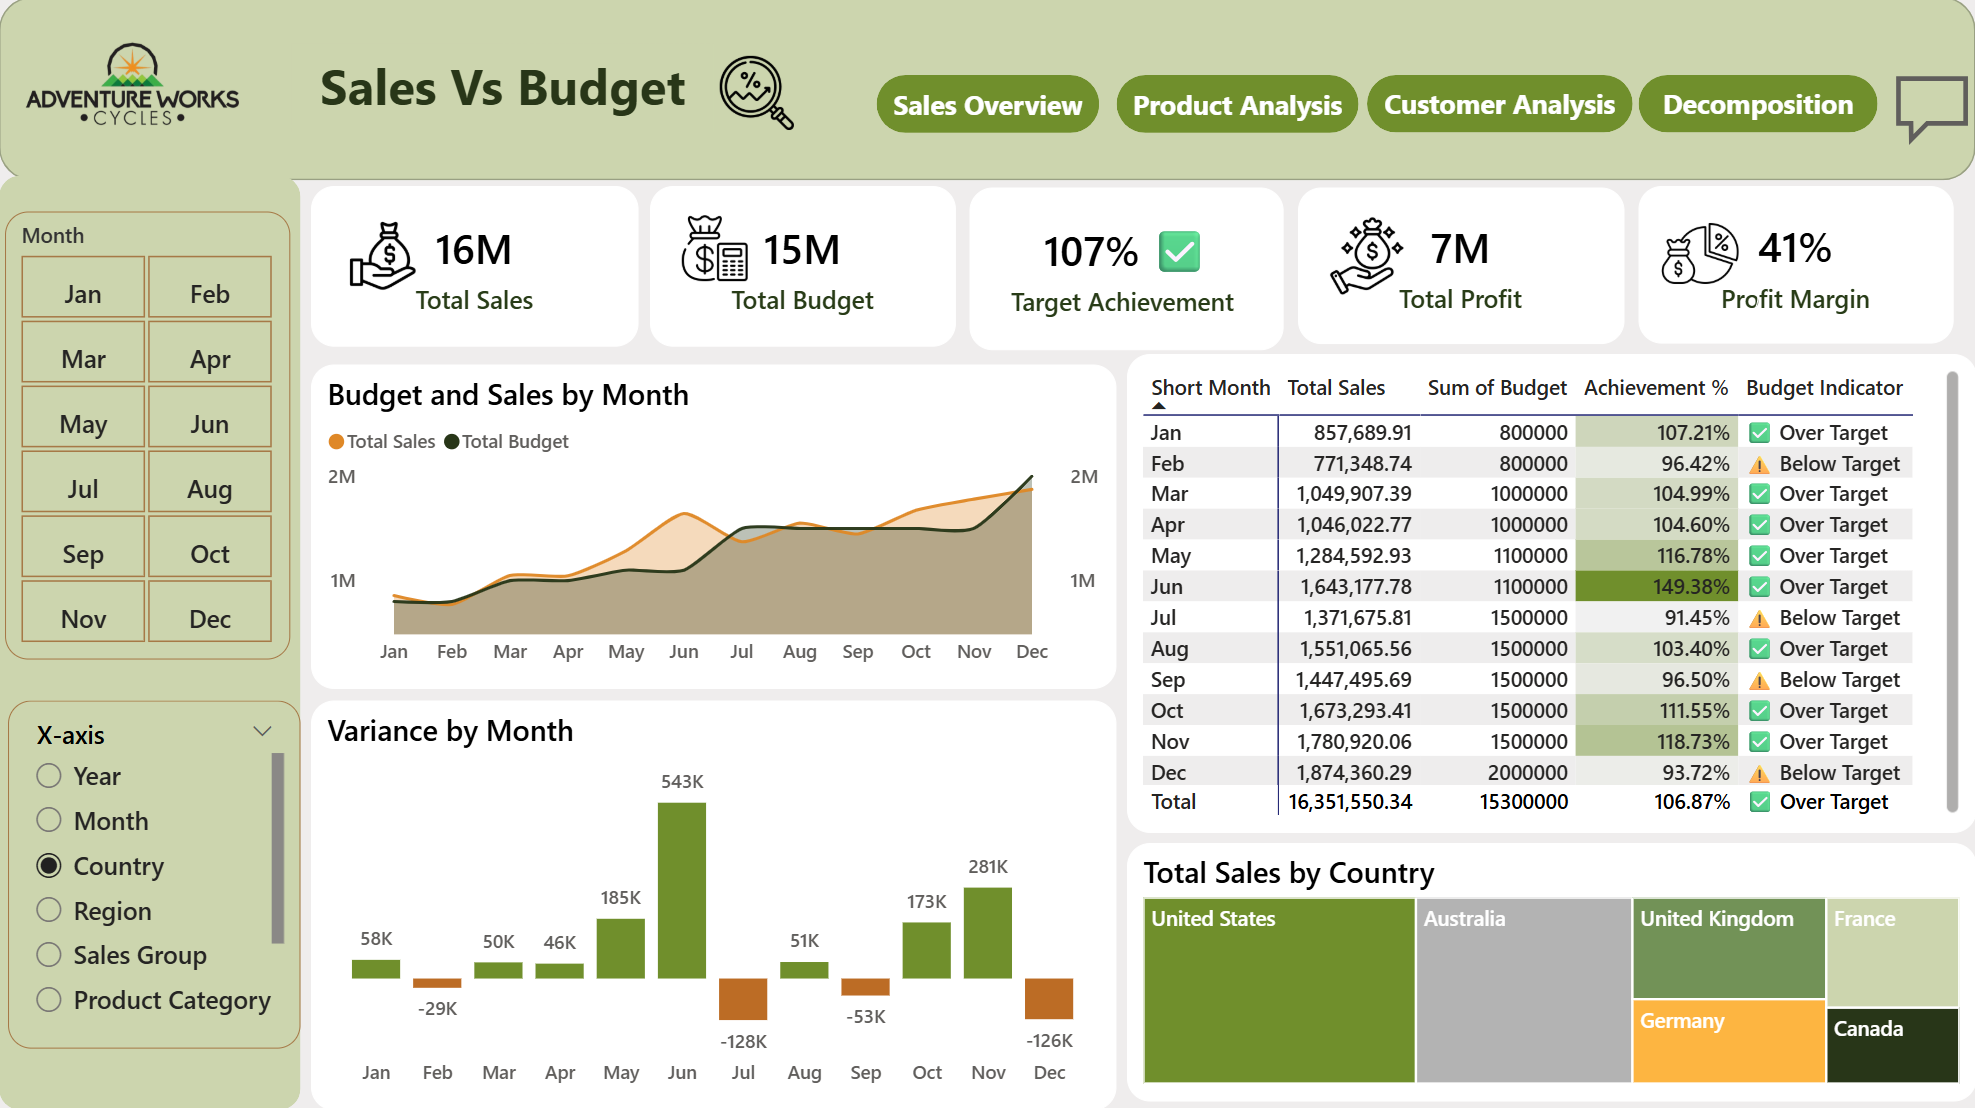
- Budget exceeded by 7% annually, though performance was inconsistent month to month — June was the strongest (149% of target), while July, September, and December fell noticeably short.
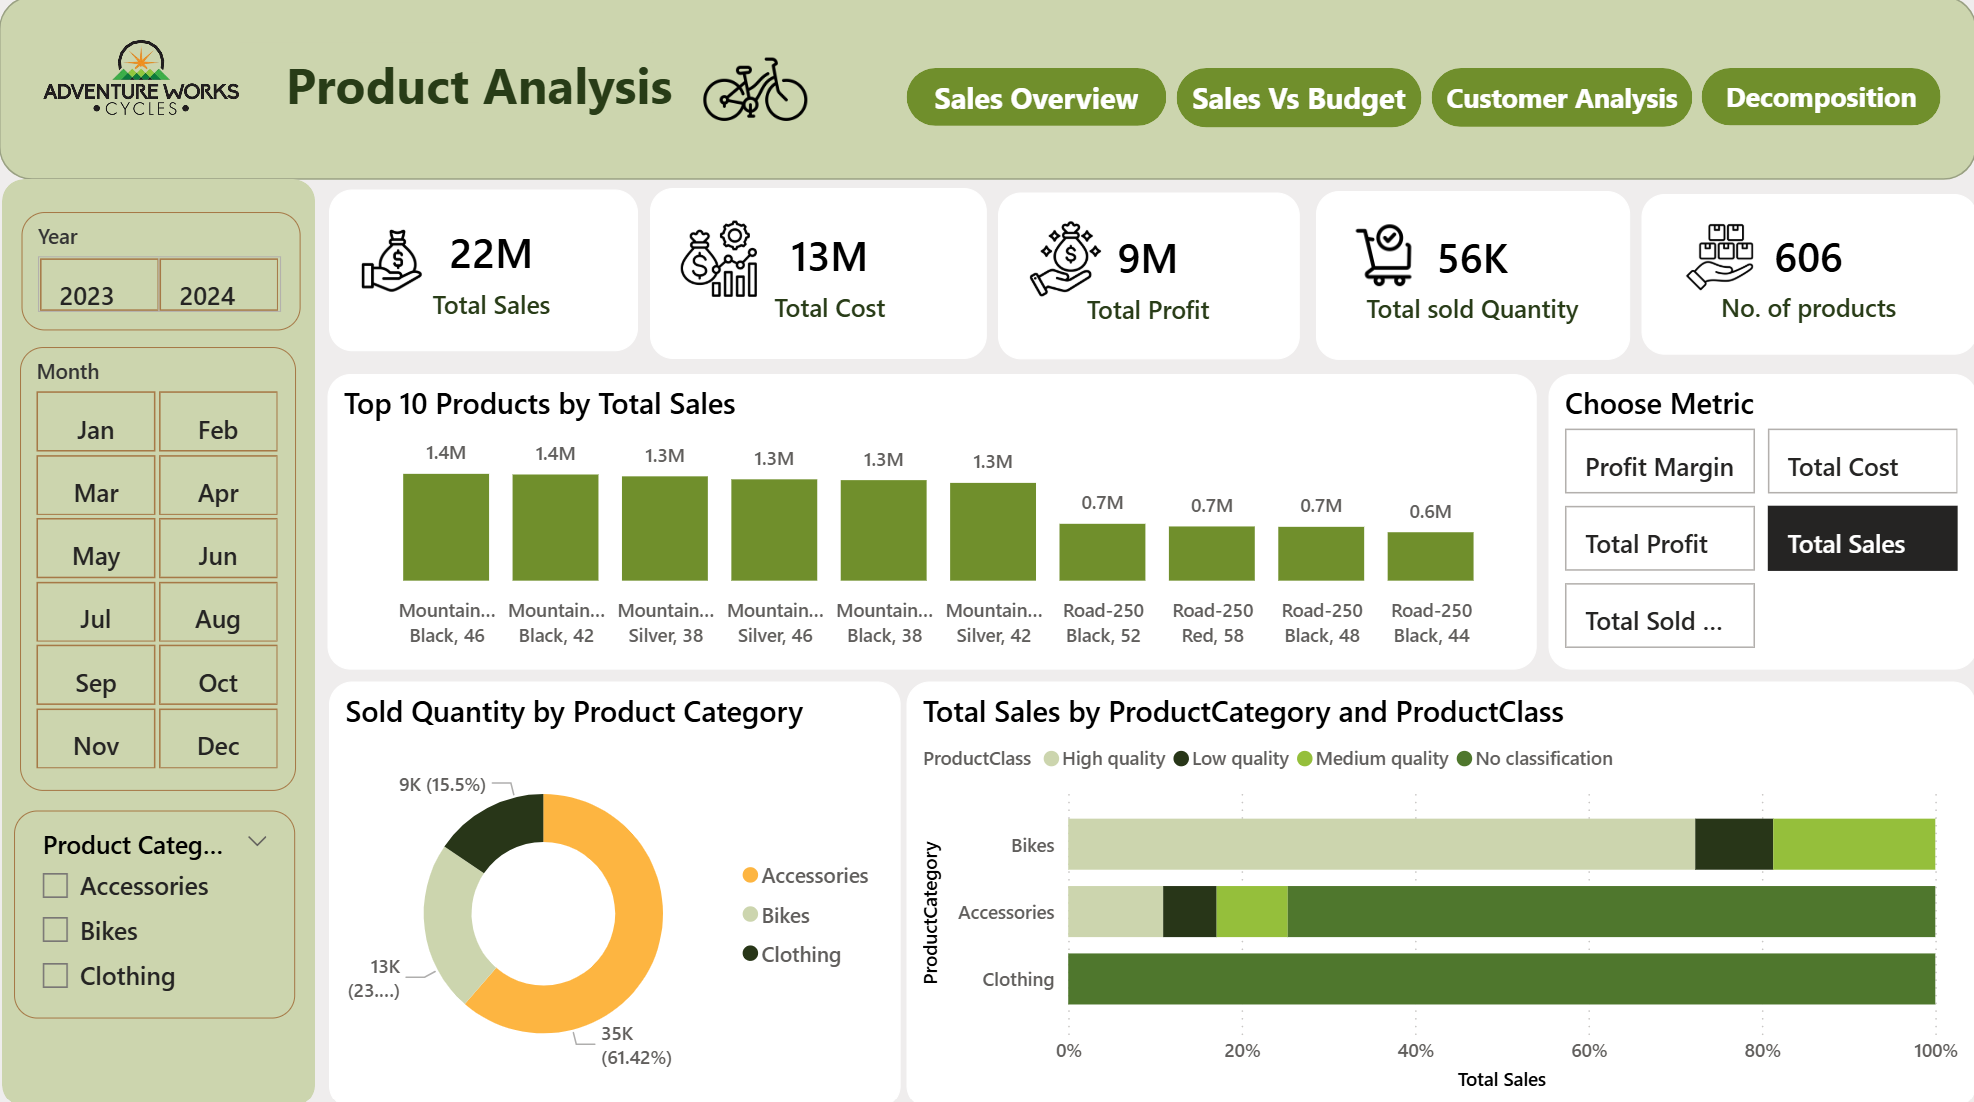
- Bikes lead the way: Road Bikes and Mountain Bikes are the most profitable subcategories, reflecting strong brand reputation.
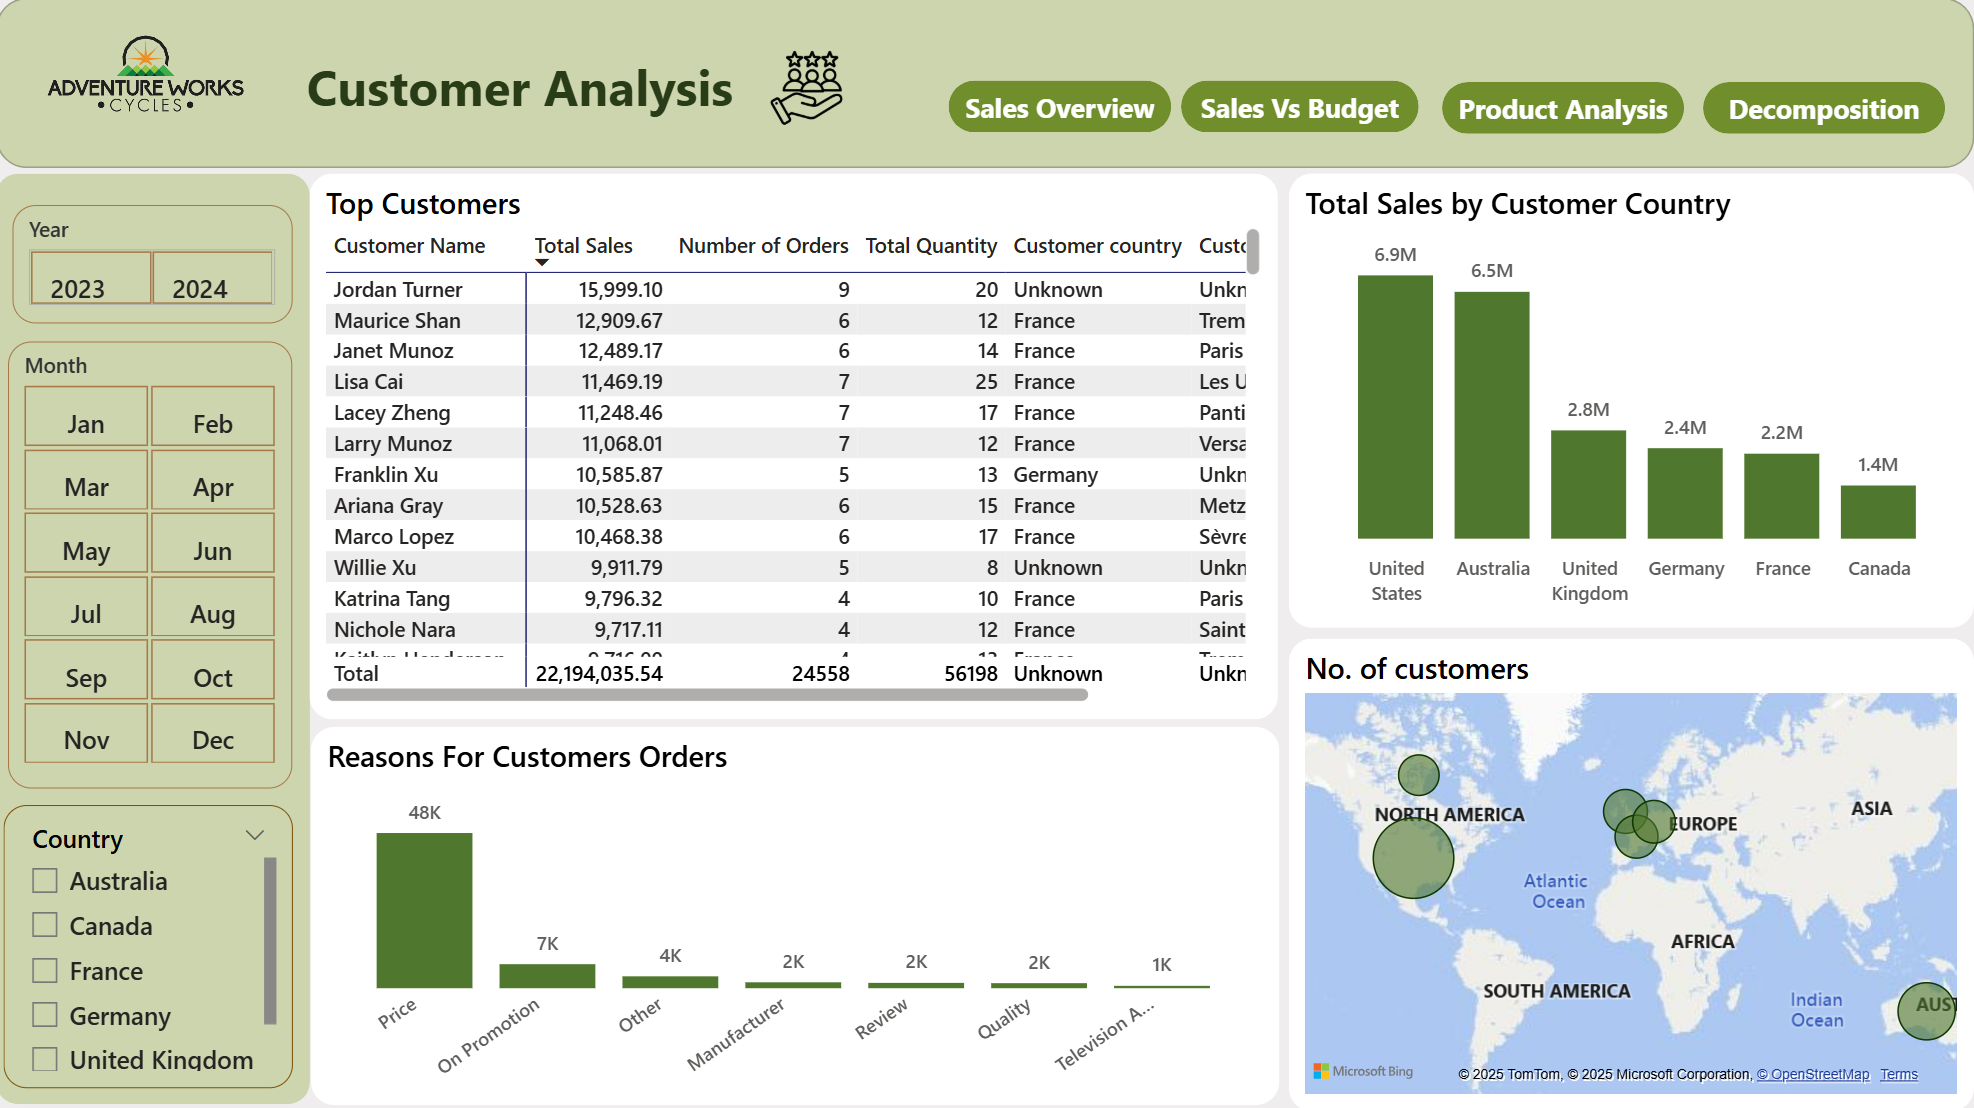
- Two key markets: the United States and Australia drive the majority of revenue.
- Price is the top driver behind purchase decisions, highlighting the strength of the pricing and promotional strategy.
Strategic Recommendations
Optimize monthly marketing spend
Shift budget from peak months like June toward underperforming months like July and September to smooth out the sales curve.
Double down on key markets
Increase investment in the USA and Australia through localized campaigns, loyalty programs, and lookalike audiences.
Leverage price as a strategic tool
Keep running competitive promotions, and introduce bundles (e.g. bike + helmet + repair kit) to raise average order value.
Focus on high-performing categories
Keep Road and Mountain Bikes reliably in stock and feature them prominently in marketing and on the homepage.